Importing Tranalyzer flows into Splunk
Contents
Prerequisites
- Newest tranalyzer2 is compiled with standard/default plugins
- Splunk 6.5.x or newer is installed, Splunk account exists,
- At least one network interface (Ethernet or WLAN) has network traffic.
Select network interface
Determine the network interface name by entering the following command at the terminal command line:
ifconfig
In the output, look for the interface name which has the IP address where the network traffic should be collected from:
en0: flags=8863<UP,BROADCAST,SMART,RUNNING,SIMPLEX,MULTICAST>
mtu 1500 inet 10.20.6.79 netmask 0xfffffc00 broadcast 10.20.7.255
Configure the jsonSink plugin
Let’s first look at the default configuration:
jsonSink
vi src/jsonSink.h
...
/* ========================================================================== */
/* ------------------------ USER CONFIGURATION FLAGS ------------------------ */
/* ========================================================================== */
#define JSON_SOCKET_ON 0 // Output to a socket (1) or file (0)
#define JSON_GZ_COMPRESS 0 // Compress the output (gzip)
#define JSON_SPLIT 1 // Split output file (-W option)
#define JSON_ROOT_NODE 0 // Surround the output with a root node (array)
#define JSON_SUPPRESS_EMPTY_ARRAY 1 // Output empty fields
#define JSON_NO_SPACES 1 // Suppress unnecessary spaces (1)
#define JSON_SELECT 0 // Use JSON_SELECT_FILE to only output specific fields
/* +++++++++++++++++++++ ENV / RUNTIME - conf Variables +++++++++++++++++++++ */
#define JSON_BUFFER_SIZE 1048576 // Size of output buffer
#define JSON_SOCKET_ADDR "127.0.0.1" // Address of the socket (require JSON_SOCKET_ON=1)
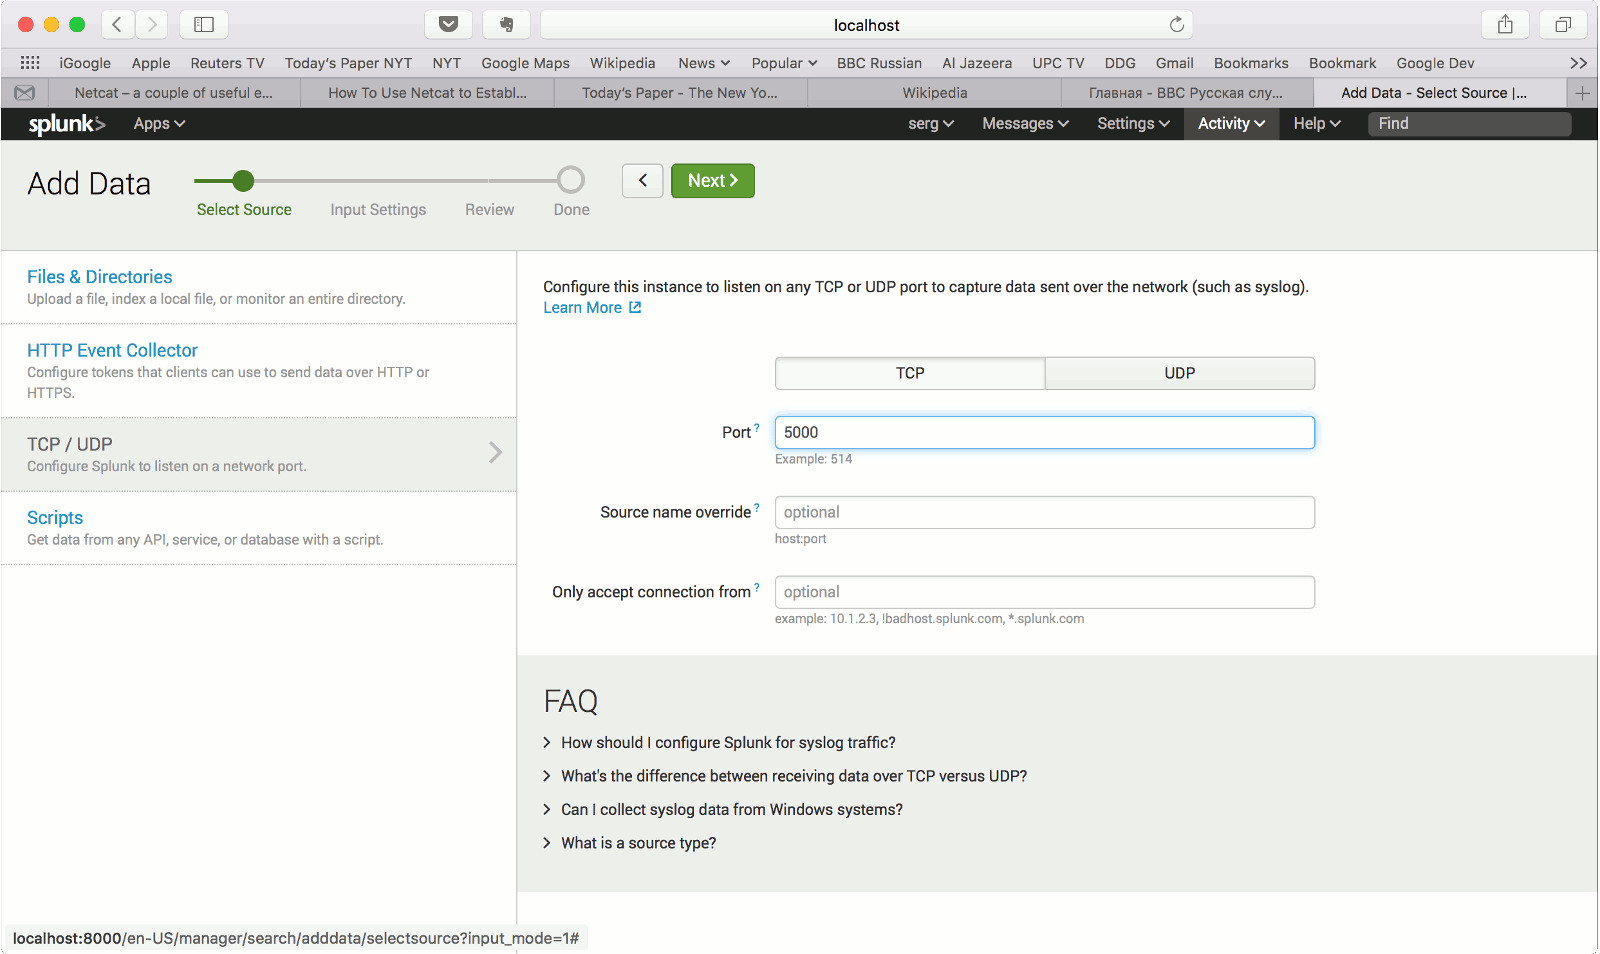
#define JSON_SOCKET_PORT 5000 // Port of the socket (require JSON_SOCKET_ON=1)
#define JSON_SUFFIX "_flows.json" // Suffix for output file (require JSON_SOCKET_ON=0)
#define JSON_SELECT_FILE "json-columns.txt" // Filename of the field selector (require JSON_SELECT=1)
// (one column name per line)
/* ========================================================================== */
/* ------------------------- DO NOT EDIT BELOW HERE ------------------------- */
/* ========================================================================== */
...Ok, now set the configuration parameters as needed:
Set SOCKET_ON to 1 to configure the output to a socket.
Set the IP address of the destination server which should receive the data stream.
If localhost will be the destination, leave the default setting of "127.0.0.1".
Set the socket server port of the destination and recompile jsonSink.
t2conf jsonSink -D SOCKET_ON=1
t2build jsonSink
Start T2
Start generating flow records by launching T2 with the interface name determined on the previous step and setting a file name as the command line arguments by entering the command:
t2 -i en0 -w test1 &
Root rights might be required to sniff traffic from an interface.
If you receive an error message, warning you about that, run the following command instead (it will run tranalyzer with sudo and will likely ask you for your password):
st2 -i en0 -w ~/results/test1 &
Note that the file name is optional for JSON stream import, if file name is not indicated the records will be shown in the standard output (besides being streamed over the configured TCP socket).
Check file output
Check that the flow records are written to the file by entering the command:
tail -f ~/results/test1_flows.txt
Flow records should be appear in the terminal. Collect traffic for some time.
Start Splunk
Start splunk by entering the following command in the directory where Splunk is installed:
splunk start
Wait for the confirmation message that splunk is up and running:
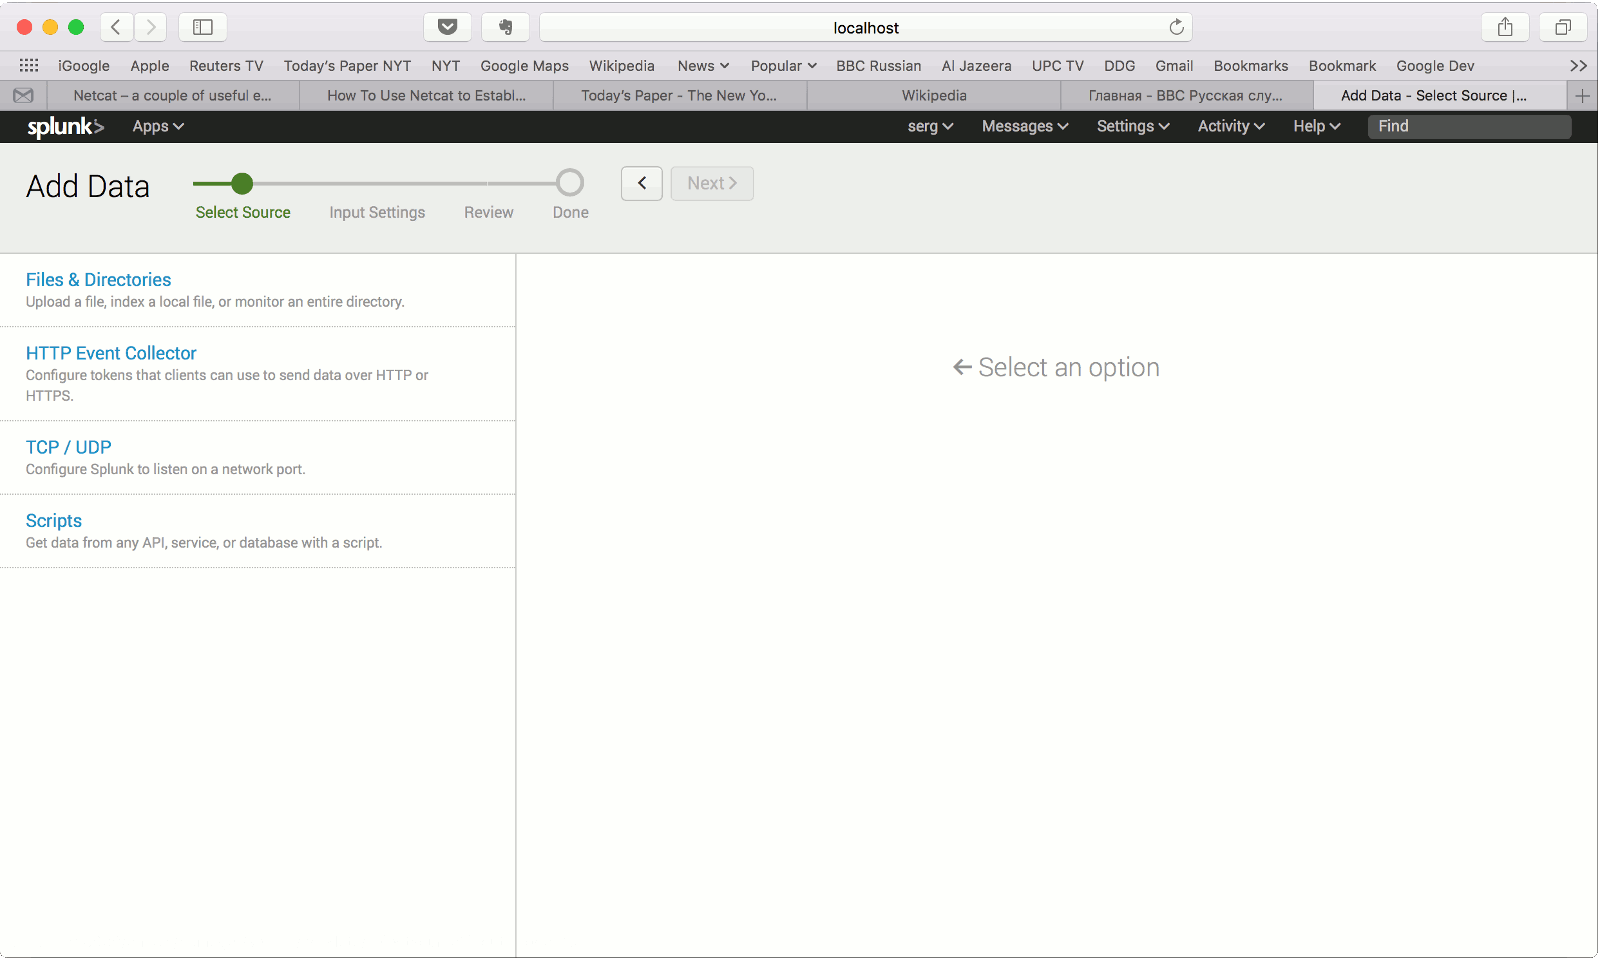
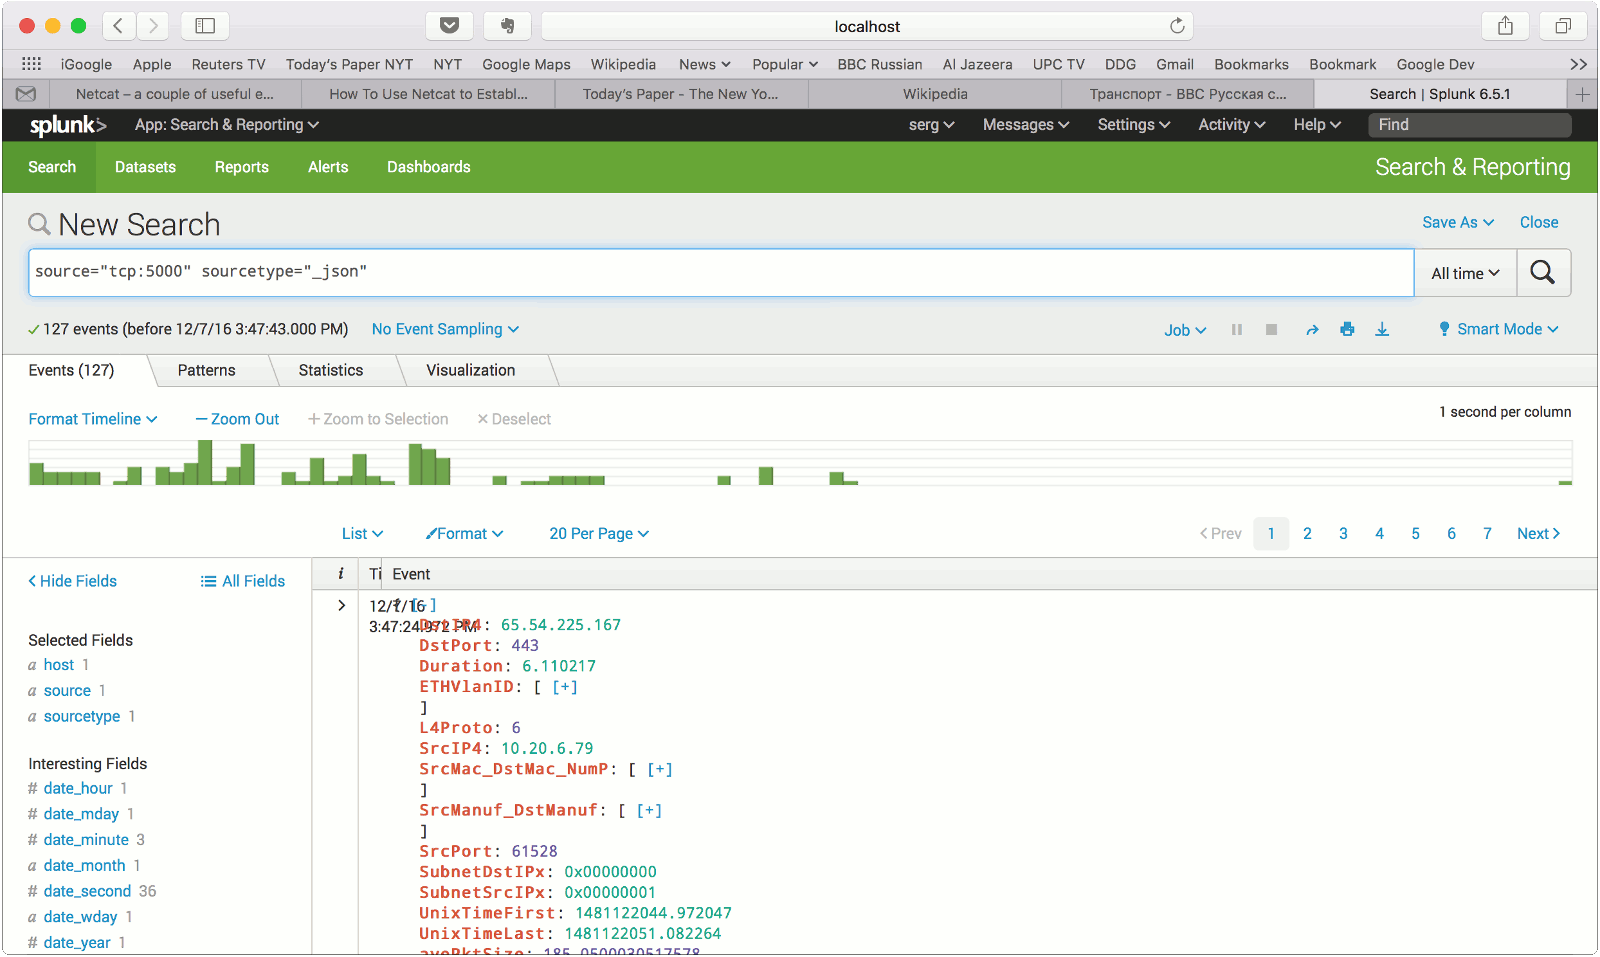
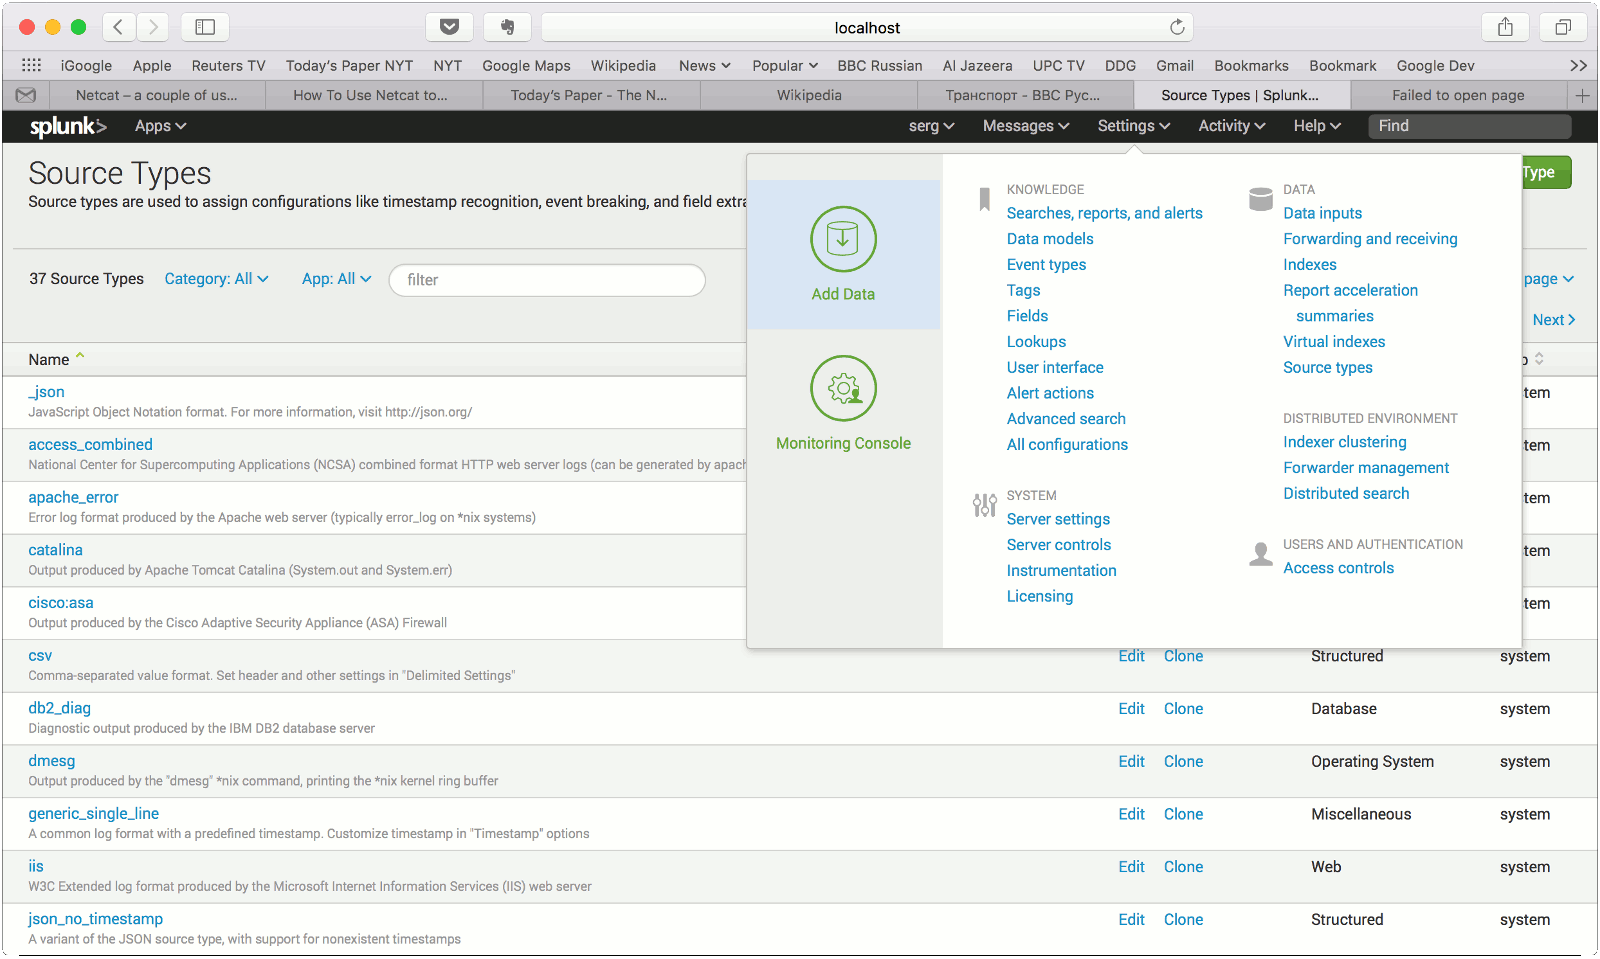
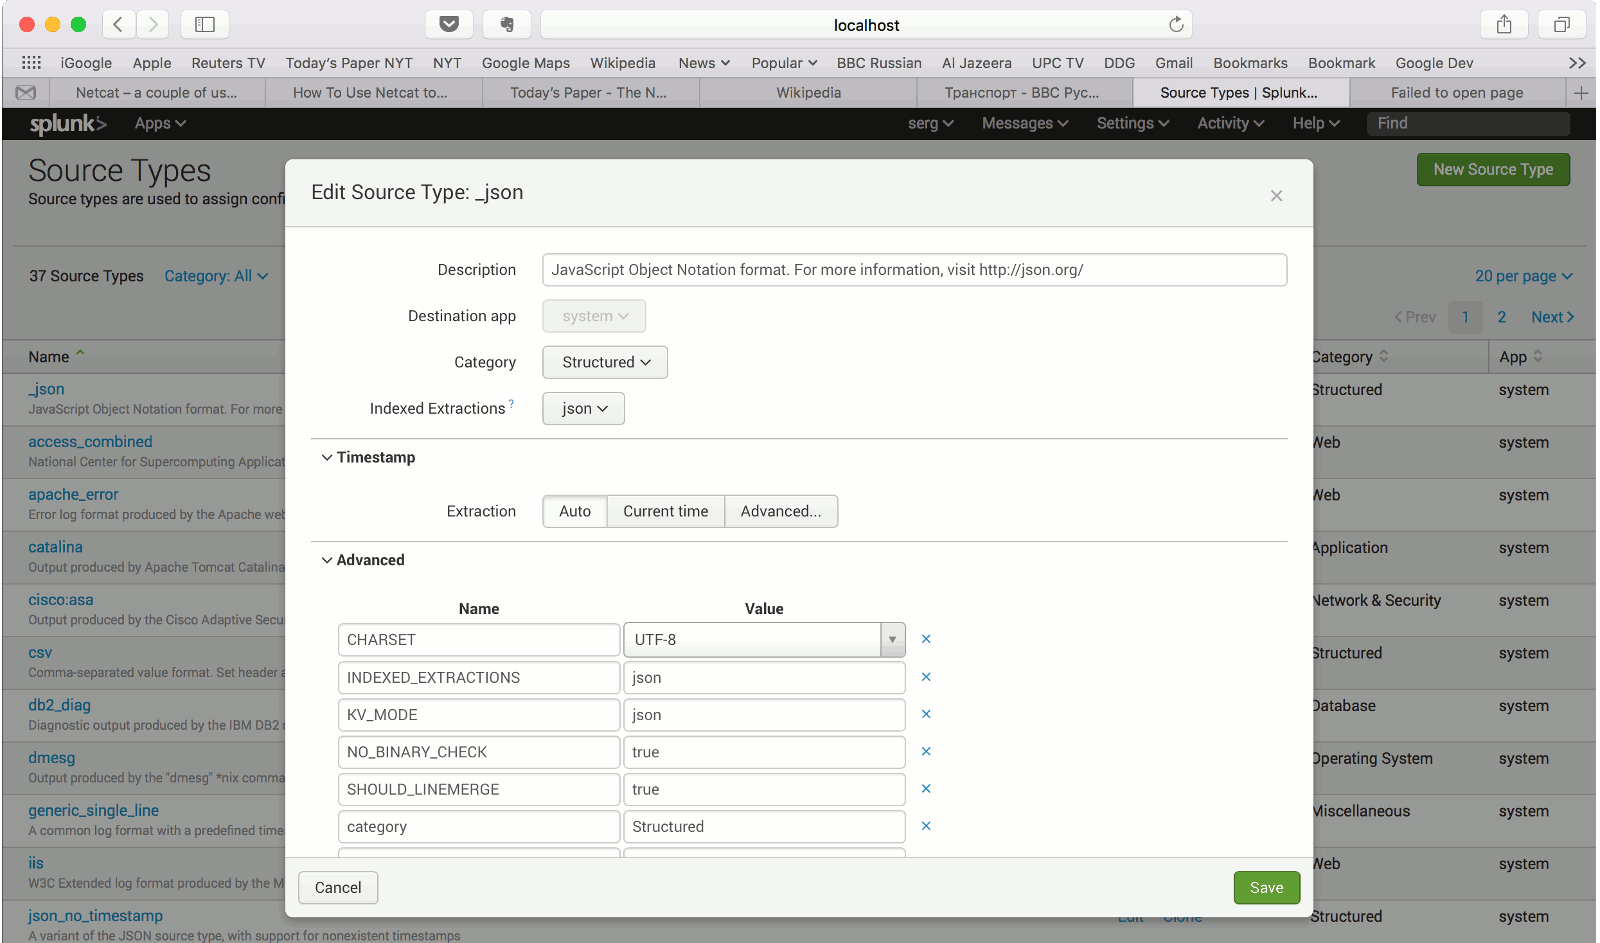
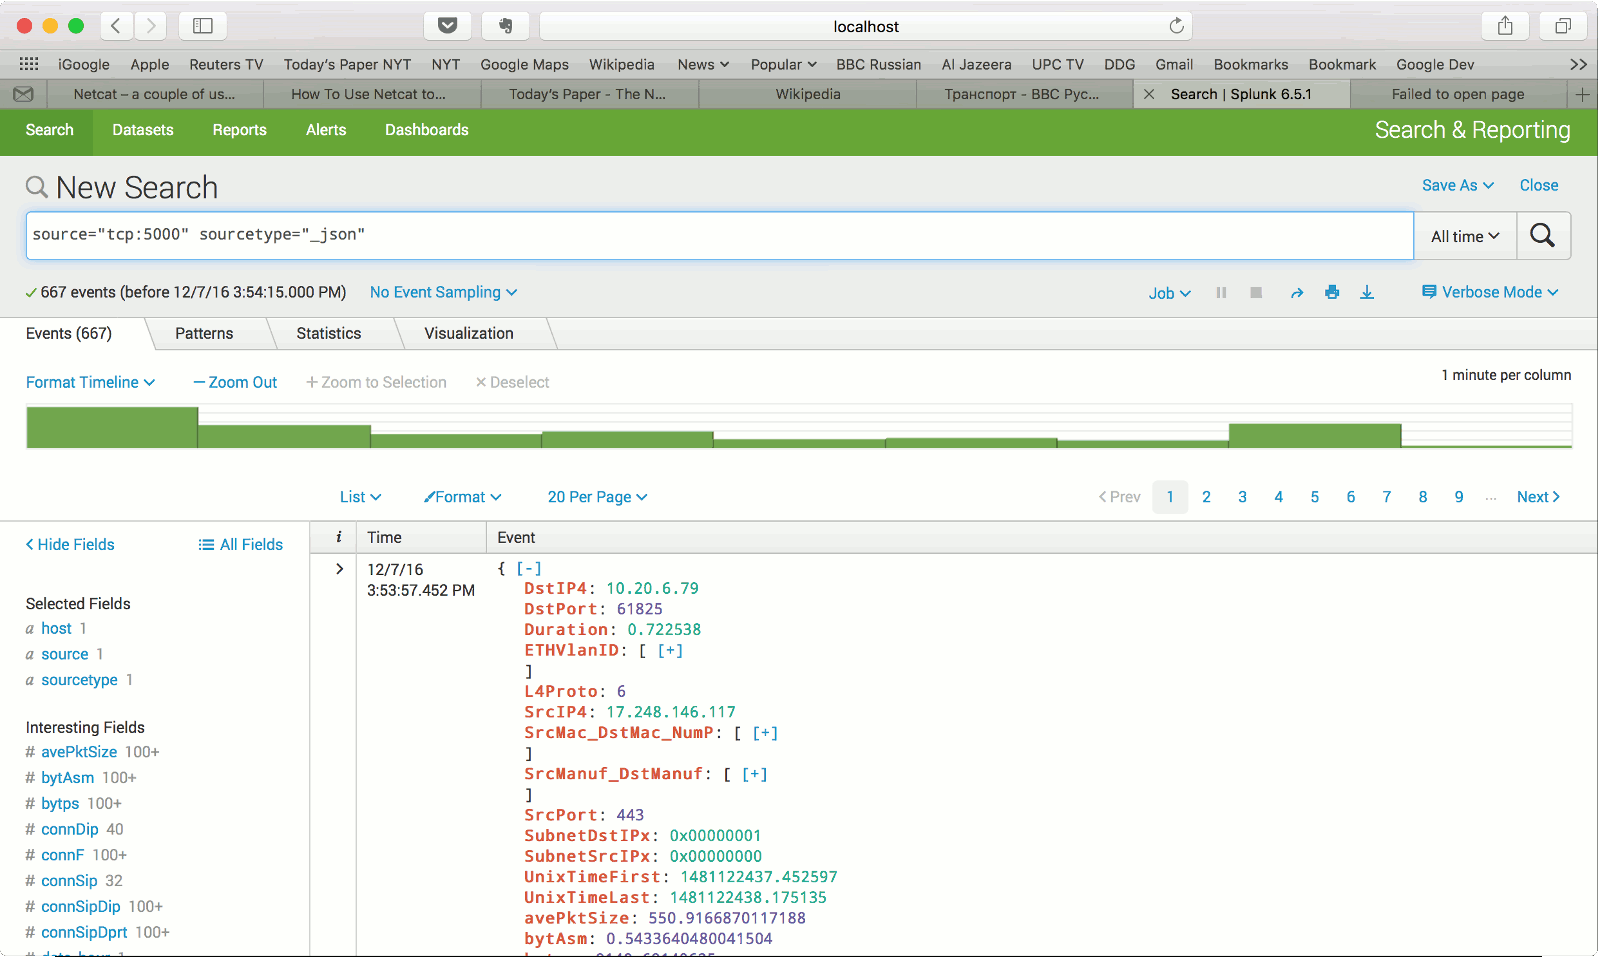
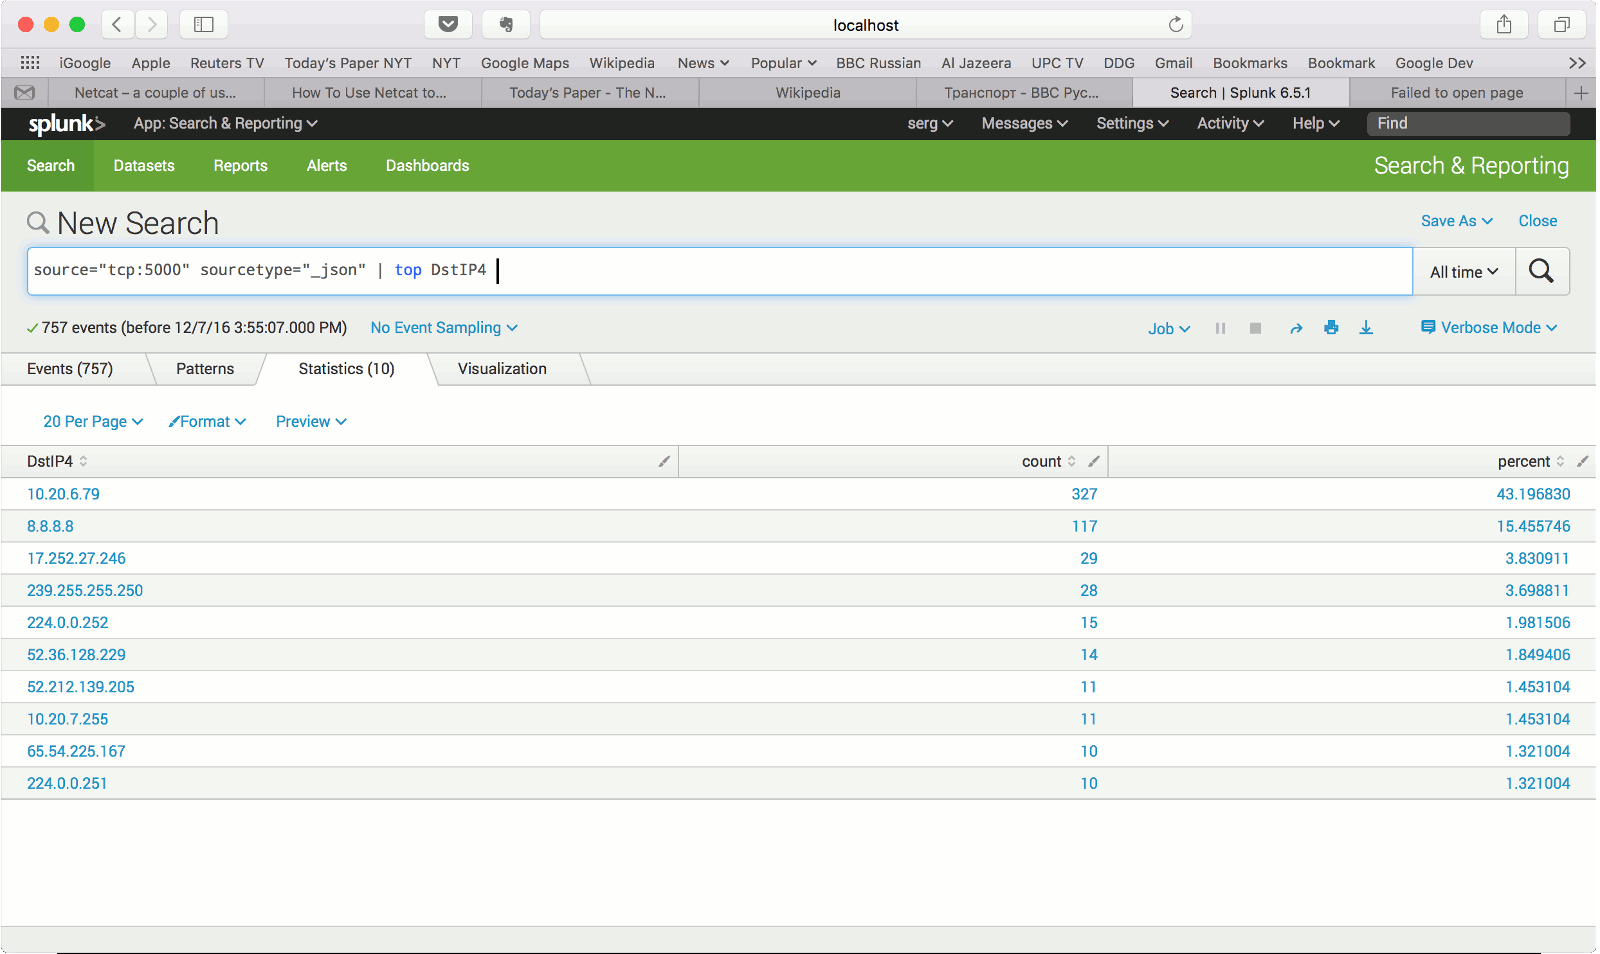
The Splunk web interface is at http://splunk_hostname:8000Login to Splunk, import and search data